
Interactive Maps & Tools
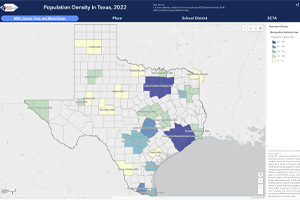
Explore our interactive population density maps for MSA, County, Tract, Block Group, Place, School District, and ZCTA geographies in Texas. Data used for these maps are based on the latest American Community Survey 5-Year estimates and TIGER/Line data from the Census Bureau.
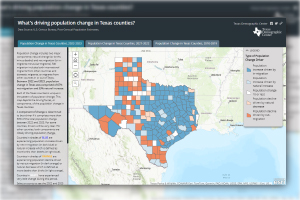
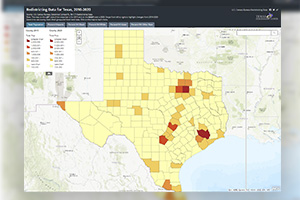
The interactive maps highlight the primary factors that have driven population changes in Texas counties since 2010, including two major components: natural change and net migration. The maps are updated annually with the latest Census Bureau population estimates.
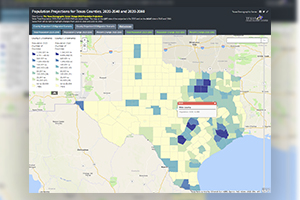
This story map uses the Texas Demographic Center’s Vintage 2022 population projections to map future county population changes. We use swipe maps to compare total population between 2020 and 2040, and between 2020 and 2060. We have also mapped population change for counties (numeric and percent) between 2020-2040 and 2020-2060. All the maps are available in the two migration scenarios, the first assumes the 2010-2020 migration rates (the 1.0 scenario), and the second assumes half the migration rates of 2010-2020 (the 0.5 scenario)
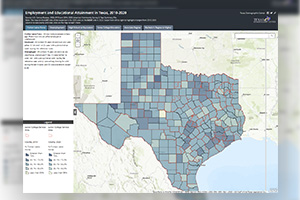
This swipe map was developed to visualize changes in employment and educational attainment in Texas between 2010-2020 at the county and the census tract level.
View 2020 Decennial Census population for Texas down to the block level and population changes between 2010 and 2020.
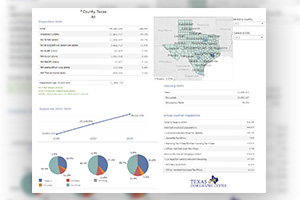
The Texas Demographic Center created this interactive tool using 2000-2020 Census Public Law 94-171 Redistricting Data to visualize changes between 2000 and 2020 by County or Council of Government.
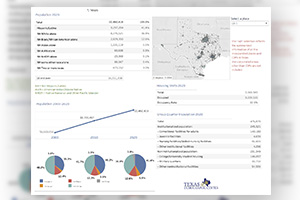
The Texas Demographic Center created this interactive tool using 2000-2020 Census Public Law 94-171 Redistricting Data to visualize changes between 2000 and 2020 by Place.
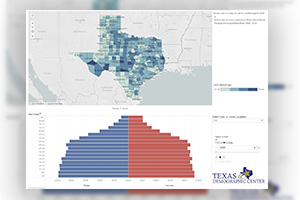
View State and County population pyramids between 2010 and 2020 by year or race and ethnicity.
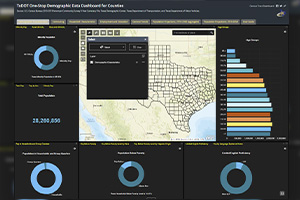
These dashboards were developed to present demographic and transportation census data with visualizations and user tutorials.
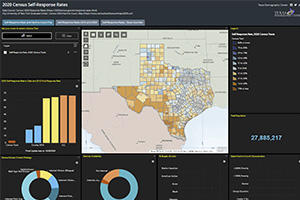
This interactive application was created to show self-response to the 2020 Census and Hard-to-Count population characteristics.
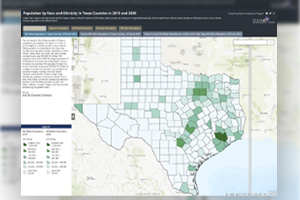
In this story map, we visualize our vintage 2018 projections employing migration patterns between 2010 and 2015 and a new race/ethnicity category - non-Hispanic Asian. We provide information on the projected population (numeric and percent) for counties by race/ethnicity.