
2021 Data Visualizations

On Nov. 30, 2021, the U.S Census Bureau released the 2020 American Community Survey (ACS) 1-Year Experimental Data. Due to the significant impact of the COVID-19 pandemic on operations and the high non-response rate, the Census Bureau has reduced or revised tables and variables than those from previous years. Different methodological strategies were also used in addressing the non-response issues.
This infographic created by the Texas Demographic Center, shows data reflecting how the Hispanic community has changed through the years in Texas. The Texas Demographic Center highlights the population growth and progress African Americans have made in entrepreneurship and education.
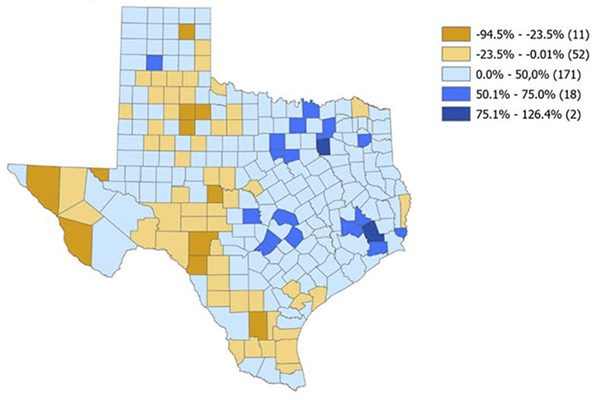
Texas added more people than any other state in the U.S. over the last decade. With eight counties by numeric change and six counties by percent change in population, Texas counties represent the majority in the top 20 counties nationally that have experienced significant population growth. Between 2010 and 2020, most of the growth occurred in the Texas Triangle and concentrated in suburban areas of Houston, San Antonio, Austin, Dallas and Ft. Worth.
Texas added more people than any other state in the U.S. over the last decade. With eight counties by numeric change and six counties by percent change in population, Texas counties represent the majority in the top 20 counties nationally that have experienced significant population growth. Between 2010 and 2020, most of the growth occurred in the Texas Triangle and concentrated in suburban areas of Houston, San Antonio, Austin, Dallas and Ft. Worth.
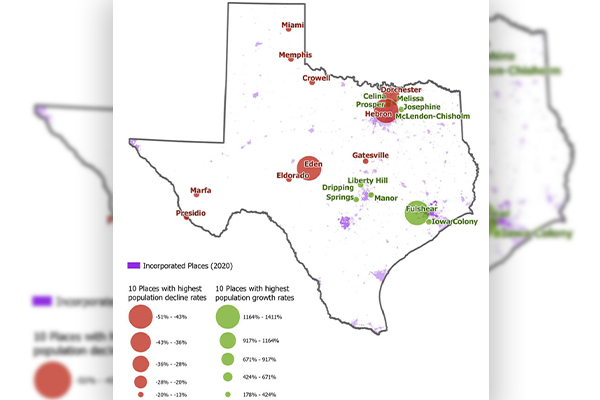
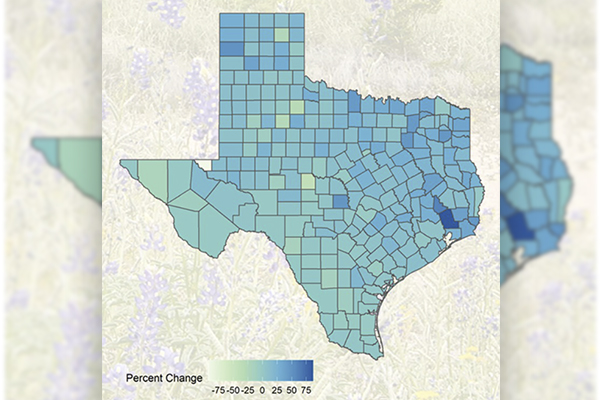
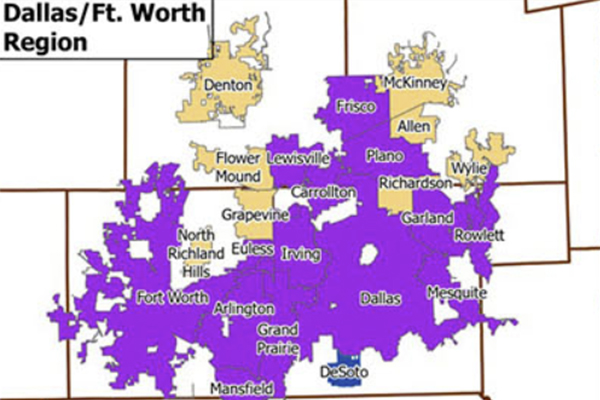
On May 27th, 2021, the U.S. Census Bureau released its sub-county population estimates, April 1, 2010 to July 1, 2020. Included are the resident population estimates for the 1,200 incorporated places in Texas, 9 of which were newly added and 13 of which have surpassed the population threshold of 50,000 since 2010. Of the 71 larger cities with population more than 50,000 in Texas, only two have lost population. In total, they contributed to more than 55% of the state population growth in the last decade. Small- and mid-size cities around the major metropolitan areas have seen the fastest growth rates, while many cities in west Texas and the Panhandle area are among the 372 cities that have lost population.
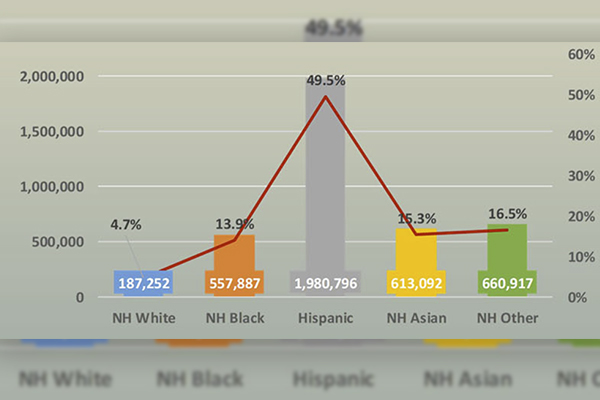
The Texas Demographic Center shows the population change in Texas from 2010 to 2020. With an population increase by 3.9 million people between 2010 and 2020, Texas has become more ethnically diverse over the past decade.
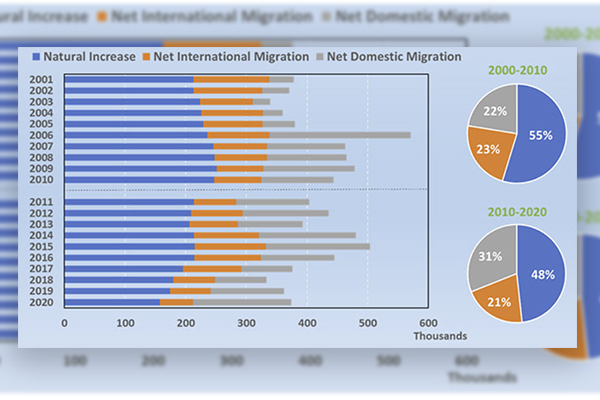
The components of population change for the nation, the states and the counties are among the data in the new release of the U.S. Census Bureau Vintage 2020 Estimates on May 4th. Data on the natural increase, or the difference between the births and the deaths, and the net migration, both international and domestic, help us understand the source of population change in the last decade.
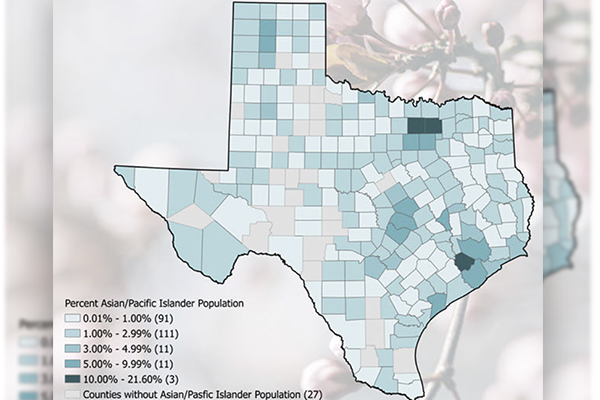
This Asian and Native Hawaiian/Pacific Islander American Heritage Month, the Texas Demographic Center highlights the population growth and progress African Americans have made in entrepreneurship and education.
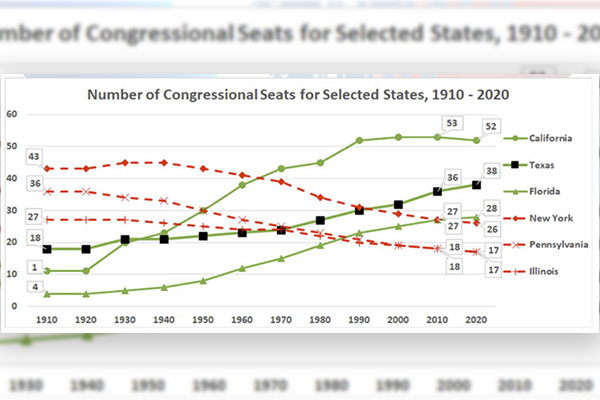
On April 26, 2021, the U.S. Census Bureau released the Apportionment Data for the U.S. and its states, the first results from the 2020 Census. Here we provide you with a closer look at Texas-specific information. Together with the release of the first population counts, the Census Bureau also released information on the quality indicators of the 2020 Census.
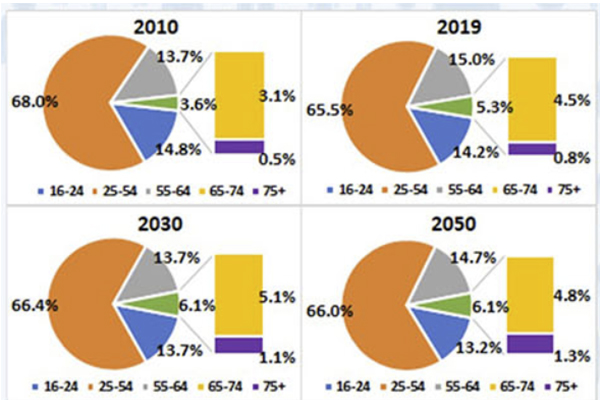
Produced by the Texas Demographic Center, this infographic provides insight into the composition of Texas' civilian labor force. It illuminates the past, present, and future dynamics of the state's labor force, highlighting Texas' ongoing diversification and the aging trends within its population.

The Texas Demographic Center recognizes the contributions of women in Texas during Women's History Month. Explore our infographic highlighting the progress women have made in education and the workforce.